library(fixest)

mods = feols(
  rating ~ complaints + privileges + learning + csw0(raises + critical) + advance,
  data = attitude
)

dict = c("rating"     = "Overall Rating",
         "complaints" = "Handling of Complaints",
         "privileges" = "No Special Priviledges",
         "learning"   = "Opportunity to Learn",
         "raises"     = "Performance-Based Raises",
         "critical"   = "Too Critical",
"advance" = "Advancement")Simpleclean revealjs theme demo
Simple modifications on clean-revealjs theme
July 11, 2023
Example slide
This is a subtitle
Before we dive a bit deeper, here is a simple example of the clean theme in action.
- No pictures or anything fancy. Just text for the moment.
Next, we’ll take a brief tour of some theme components.
- We’ll use the same basic structure as the original LaTeX slides.
- Note that the full suite of Reveal.js features are available for this Quarto implementation, even if we don’t cover everything here.
Before you proceed…
Requirements for the coding examples in this demo
R libraries
While the clean theme is language agnostic, we will use several R coding examples in this demo to highlight some advanced theme features.
You will need the following libraries if you’d like to render the template “as-is”:
TinyTex
While reveal.js presentations are HTML format, we will show an example of how to embed LaTeX tables as images. This requires a working Tex distribution, of which TinyTex provides by far the easiest and lightest integration with Quarto. More details here.
Components
Components
Ordered and Unordered Lists
Here we have an unordered list.
- first item
- sub-item
- second item
And next we have an ordered one.
- first item
- sub-item
- second item
Components
Alerts & Cross-refs
To emphasize specific words or text, you can:
- Use the default
.alertclass, e.g. important note. - Use the
.fgclass for custom colour, e.g. important note. - Use the
.bgclass for custom background, e.g. important note.
To cross-reference, you have several options, for example:
- Beamer-like
.buttonclass provided by this theme, e.g. Appendix - Quarto’s native cross-ref syntax, e.g., “See Section 4.4.”
Components
Citations
Citations follow the standard Quarto format and be sourced from BibLaTex, BibTeX, or CLS files. For example:
Topic 1: Spatial Frictions (Fajgelbaum et al. 2018; Hsieh and Moretti 2019; Moretti 2011)
Topic 2: Blah (Suárez Serrato and Zidar 2016)
Components
Blocks
Quarto provides dedicated environments for theorems, lemmas, and so forth.
But in presentation format, it’s arguably more effective just to use a Callout Block.
Regression Specification
The main specification is as follows:
\[ y_{it} = X_{it} \beta + \mu_i + \varepsilon_{it} \]
Components
Multicolumn I: Text only
Column 1
Here is a long sentence that will wrap onto the next line as it hits the column width, and continue this way until it stops.
Column 2
Some other text in another column.
A second paragraph.
Multicolumn support is very flexible and we can continue with a single full span column in the same slide.
Components
Multicolumn II: Text and figures

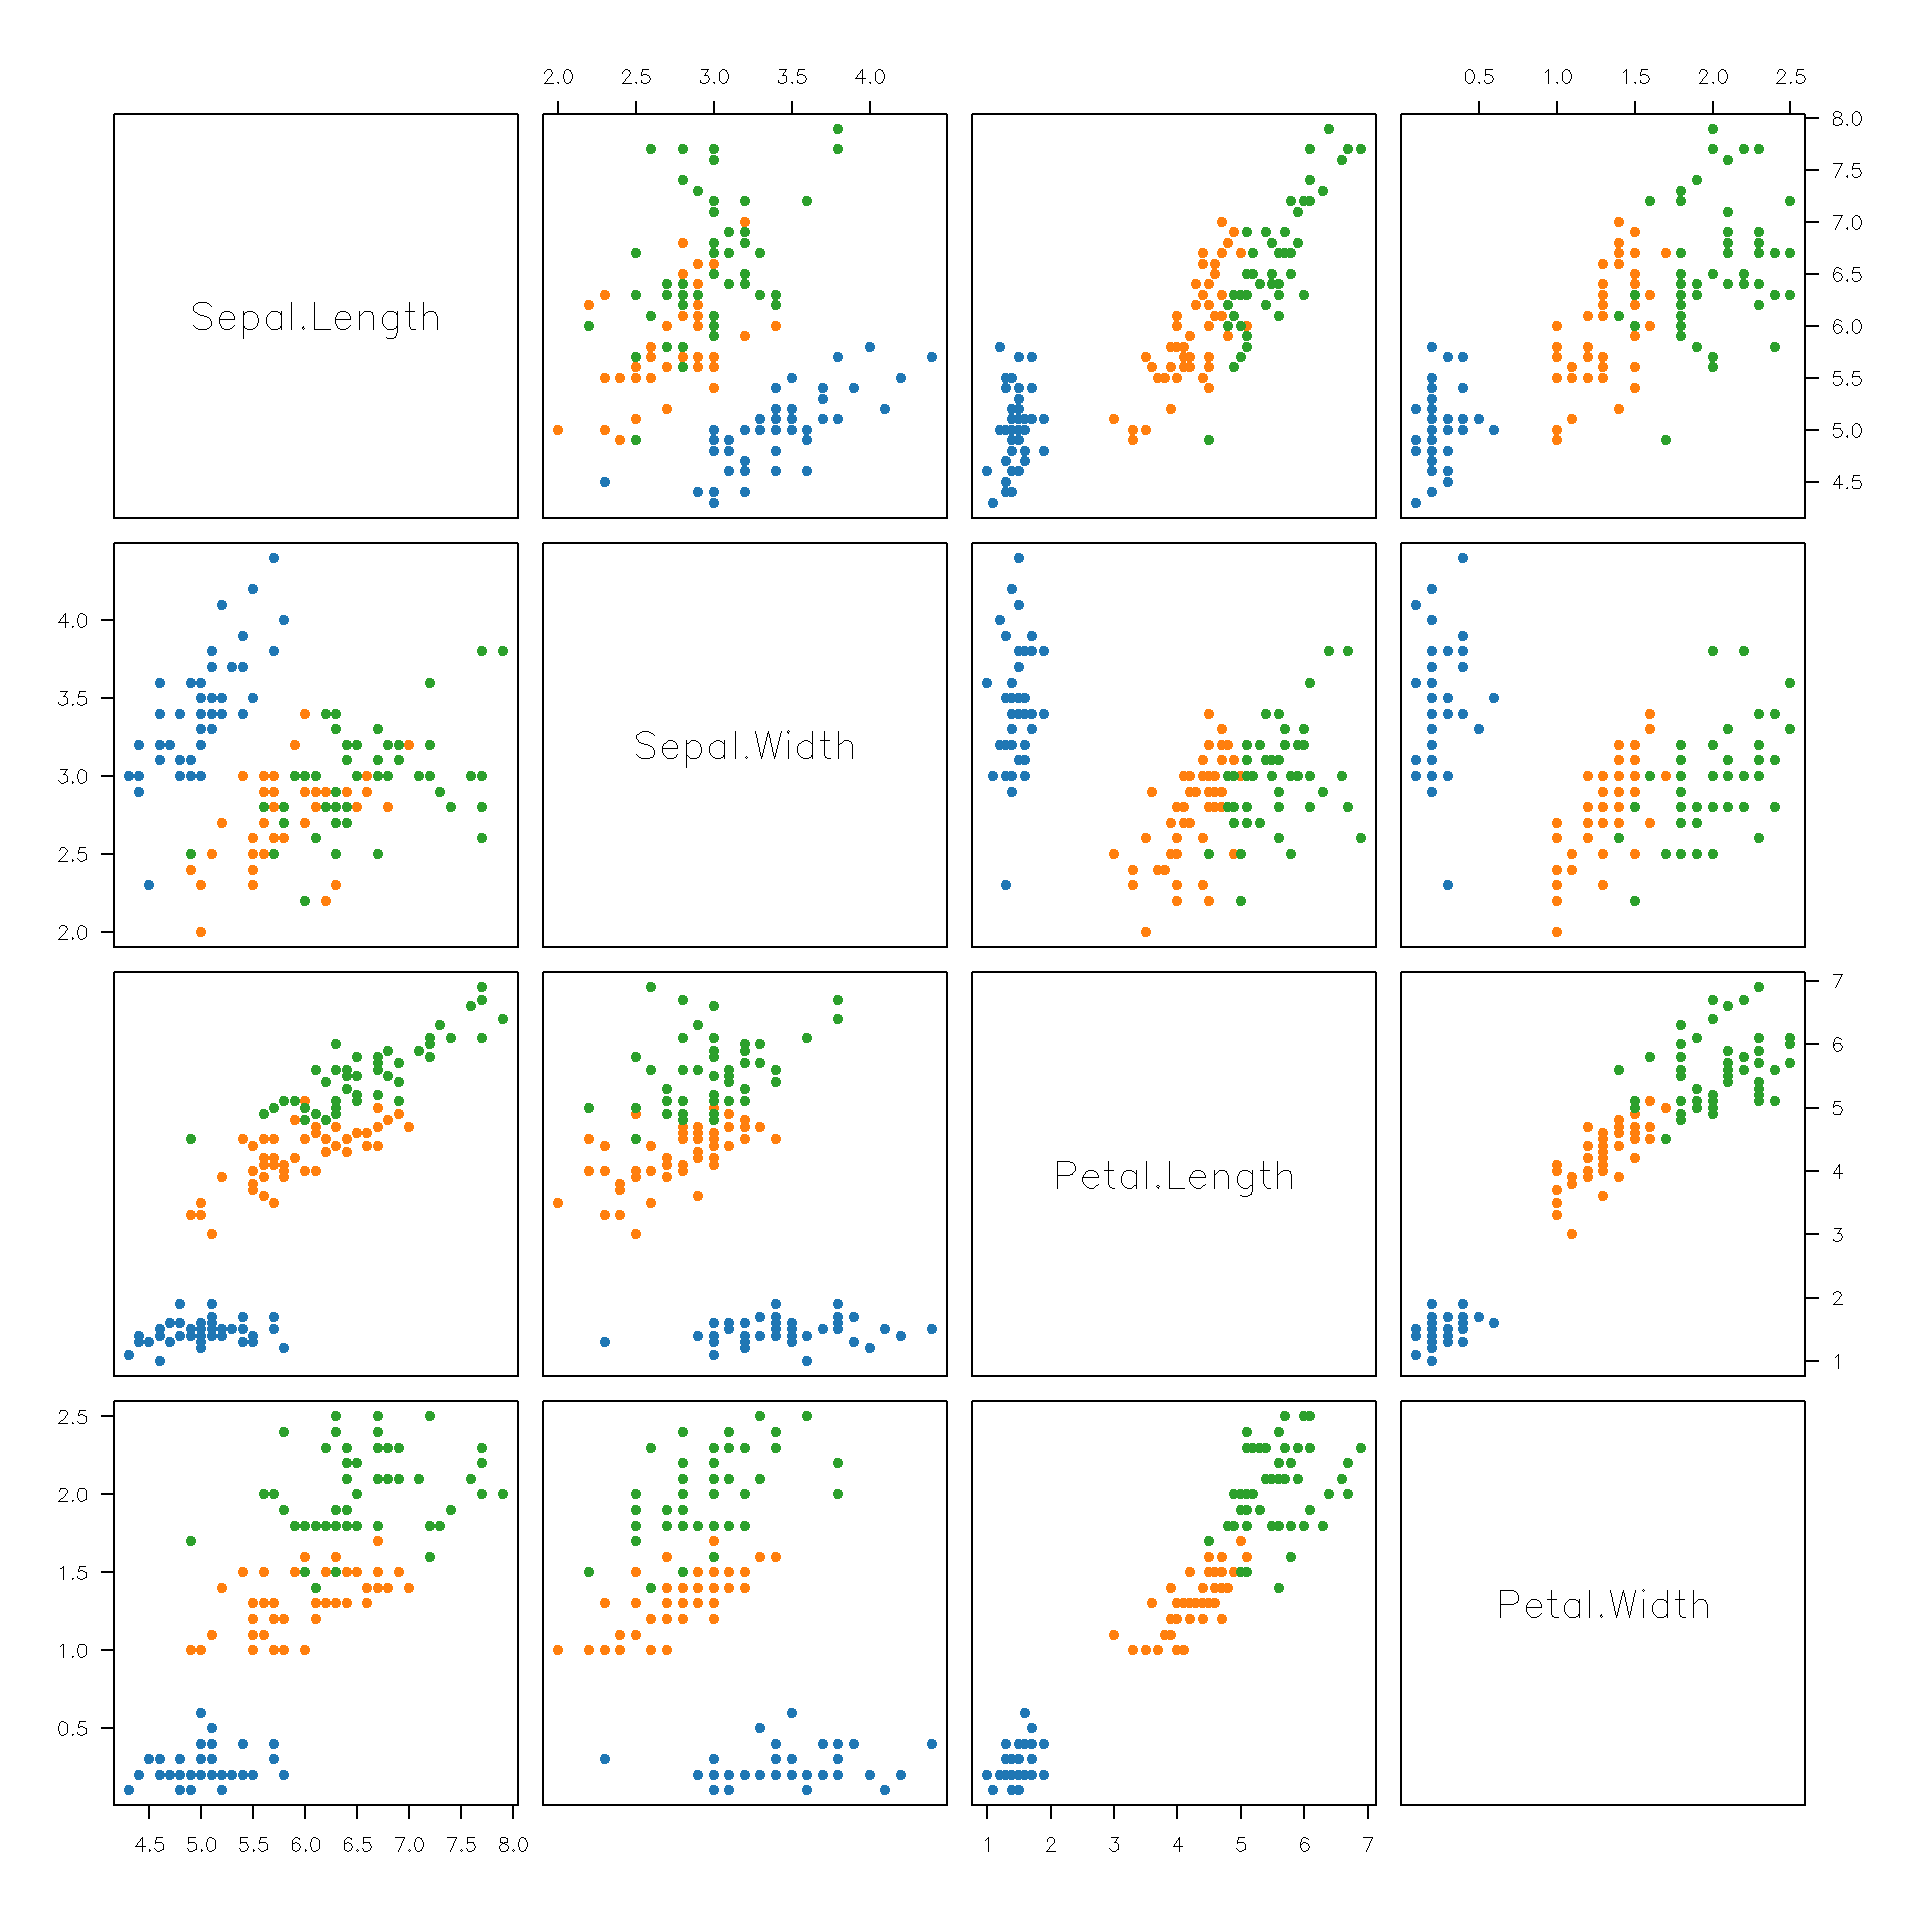
- A point about the figure that is potentially important.
- Another point about the figure that is also potentially important.
Note that sub- and multi-panel figures are also natively supported by Quarto. See here.
Components
Multicolumn III: Code and output
Tables
Tables
Regression example
Quarto offers excellent table support, with further customization via user libraries. Let’s illustrate with a regression example:
Regression table
modelsummary
If you use modelsummary with this Quarto theme, we advise setting the gt backend for a cleaner aesthetic. More details here.
Regression table
| Dependent variable: Overall Rating | ||
|---|---|---|
| (1) | (2) | |
| Handling of Complaints | 0.653*** | 0.613*** |
| (0.131) | (0.161) | |
| No Special Priviledges | -0.077 | -0.073 |
| (0.131) | (0.136) | |
| Opportunity to Learn | 0.324+ | 0.320+ |
| (0.157) | (0.169) | |
| Performance-Based Raises | 0.082 | |
| (0.221) | ||
| Too Critical | 0.038 | |
| (0.147) | ||
| Advancement | -0.172 | -0.217 |
| (0.149) | (0.178) | |
| Num.Obs. | 30 | 30 |
| R2 | 0.729 | 0.733 |
| Std.Errors | IID | IID |
| + p < 0.1, * p < 0.05, ** p < 0.01, *** p < 0.001 | ||
Regression table
etable
fixest’s powerful native tabling functions were designed for LaTeX output. But we can use the markdown = TRUE option to make them work with this theme too. (Details here.) Quick notes:
- Install the
tinytex&pdftoolspackages first. - Set the R chunk option
output: asis.
Regression table
etable (cont.)
Figures
Figure
Figure
Full-size Figures
You can use the {.background-image} container environment to completely fill the slide background with an image.
Ideally, your figure will be the same aspect ratio as the screen that you’re presenting on.
- This can be a bit tricky because of the dynamic nature of reveal.js / HTML. But it’s probably something close to 16:9.
- Aspect ratio can also matter for a regular full-frame images (previous slide).
Interactive plots
Note: Simple flight data example using threejs. There are many interactive plotting options beyond this. (More details.)
Summary
Summary
A minimal and elegant presentation theme
The Quarto reveal.js clean theme aims to be a minimal and elegant presention theme.
We have highlighted some theme-specific components. But all of the regular reveal.js functionality is supported (chalkboard, etc.)
Install the theme:
Use these demo slides as a template:
Test Slide
This is a test slide
What is an event?
Some outcome that we can potentially or hypothetically observe or experience( e.g. outcome of rolling a fair sided dice)
What is probability?
Chance of an event occurring
What are odds?
Representation: Event happens: Doesn’t happen (a:b)
If odd of event B is Odds(B) = a:b then -> Probability of event is \(P(B) = \frac{a}{a+b}\)
What are Expectations?
The expected value of a random variable X is a weighted average of values X can take, with weights given by the probabilities of those values .If X can take on only a finite number of values(say, x1, x2,…, xn),we can calculate the expected value as
\[ E(X) = \sum_{i}^{n}(x_i.P(X=x_i)) \]
References
Fajgelbaum, Pablo D, Eduardo Morales, Juan Carlos Suarez Serrato, and Owen Zidar. 2018. “State Taxes and Spatial Misallocation,” 90.
Hsieh, Chang-Tai, and Enrico Moretti. 2019. “Housing Constraints and Spatial Misallocation.” American Economic Journal: Macroeconomics 11 (2): 39.
Moretti, Enrico. 2011. “Local Labor Markets.” In Handbook of Labor Economics. Vol. 4. Elsevier.
Suárez Serrato, Juan Carlos, and Owen Zidar. 2016. “Who Benefits from State Corporate Tax Cuts? A Local Labor Markets Approach with Heterogeneous Firms.” American Economic Review 106 (9).
Appendix
| Unique (#) | Missing (%) | Mean | SD | Min | Median | Max | |
|---|---|---|---|---|---|---|---|
| rating | 22 | 0 | 64.6 | 12.2 | 40.0 | 65.5 | 85.0 |
| complaints | 23 | 0 | 66.6 | 13.3 | 37.0 | 65.0 | 90.0 |
| privileges | 24 | 0 | 53.1 | 12.2 | 30.0 | 51.5 | 83.0 |
| learning | 23 | 0 | 56.4 | 11.7 | 34.0 | 56.5 | 75.0 |
| raises | 21 | 0 | 64.6 | 10.4 | 43.0 | 63.5 | 88.0 |
| critical | 21 | 0 | 74.8 | 9.9 | 49.0 | 77.5 | 92.0 |
| advance | 20 | 0 | 42.9 | 10.3 | 25.0 | 41.0 | 72.0 |